

Why we must use percentages to analyze demand variability
FEATURE – In the latest article in his series on how to effectively level production, Ian Glenday discusses why the perceived high variability of our demand is actually the result of a misconception… think about it in percentage terms!
Words: Ian Glenday, lean coach and author
The previous article in this series taught you how to start levelled production. This entails analyzing your production and demand, using the Glenday Sieve to identify the 6% of products or tasks accounting for 50% of the volume or work. These are then put into a fixed six-to-eight week repetitive cycle.
The problem many people raise at this point is that (they believe) the demand for these “greens” is too variable to have a fixed schedule. What they think they need, instead, is a flexible schedule that changes to meet demand variability, as they have now, even though this creates plan changes and fire-fighting. Not a good foundation for sustainable continuous improvement and standardization!
Let’s challenge this perception of demand variability for the greens.
To do this one needs to have an understanding of the central limit theory. Put simply, bigger volumes have less percentage variability than smaller volumes. This is because, in general, bigger volume items are coming from a larger number of customers so the variability in demand from individual customers is balanced out at the aggregate level. Correspondingly, smaller sellers come from fewer customers with less of this balancing out, resulting in higher percentage variability.
Ironically, because people generally measure production and sales at the unit level, rather than percentage, many of them consider the bigger sellers to have the greatest variability because the volume changes are large with the smaller items having only a small variability in unit sales – see the table below. The figures shown are for actual sales over a six-week period for a well-known brand of yoghurt, comparing two products with very different sales volumes.
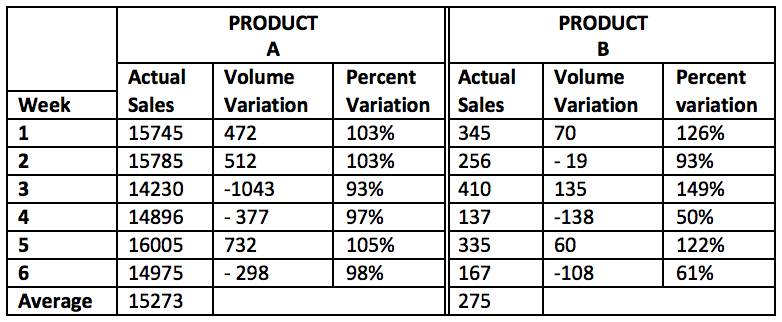
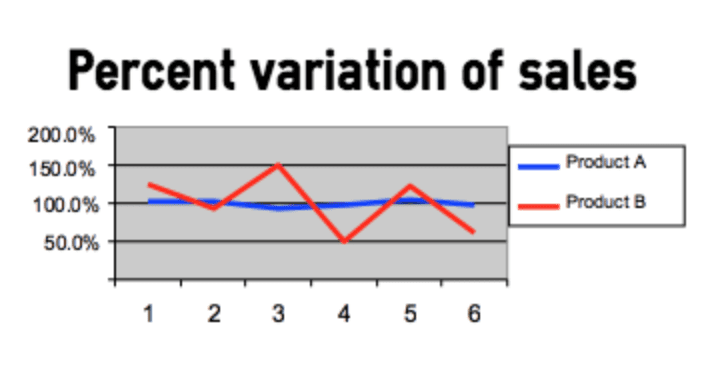
The bigger item has unit variability compared to average sales of between +732 and -1,043 – a range of 1,775 units! The unit variability for the smaller item, compared to average sales, is only 273 – so seen as much smaller variability. However, when one looks at percent variability, best shown graphically, one gets a very different picture.
What’s required is a buffer tank, with limits set according to the actual variability around average sales, for the larger volume green items. With flow logic the calculation of what to make and when has been done by people working together on the green-stream schedule. Therefore, the planning system does not need to “plan production.” What is needed, instead, is a reporting mechanism to highlight when stock goes outside the buffer tank limits. As the limits are set on the known historical actual sales variability one would not have expected stock outside the limits, so this works as a warning to look at what has happened.
Being outside the limits is not necessarily “bad” and certainly should not trigger an automatic change of the plan. The limits are merely there to highlight to the planner they should investigate what has happened that has caused the stock to be higher or lower than expected. For this reason the buffer limits are not critical and don’t automatically create any actions. Green products will continue to be made each cycle at the same time and in the same quantities – there is a built-in stability in flow logic and repetitive cycles. The setting of the limits has more to do with judgement than mathematical calculation. Some people are naturally cautious and tend to set the limits wide; others are more aggressive in wanting inventories to be reduced and set lower limits with less safety stock. Many planners find it difficult to accept these limits are not critical after years of detailed analysis to determine the optimum setting for re-order point and safety stock.
Here is an example from a very different environment to manufacturing to help illustrate this lack of variability in green stream items – despite how variable people think their demand is. Having implemented repetitive cycles in an operating room, it was suggested to a hospital that they look at the accident and emergency department (A&E). One of the fundamentals of fixed cycles is having a relatively predictable demand for the green items, which in A&E would be the number of patients with the same or similar injuries and medical issues. The response of the doctors was, predictably, that demand in A&E was highly variable and unpredictable, precisely because it was accidents and emergencies, which were not possible to foresee. They lived it every day and they knew it was highly variable.
Upon looking at the data, however, certain patterns started to emerge. It was true that demand on different days of the week and at different times of the day was very variable. But demand on any particular day and time was amazingly consistent for the “green” injuries and medical issues. One needed to compare Wednesday afternoons to Wednesday afternoons or Saturday nights to Saturday nights. By doing so, we realized that doctors and other staff working in A&E had not seen these patterns. Why? They worked shifts – sometimes days, sometimes nights – with different days worked by each person each week. Consequently they were presented with different demands every time they came to work. To be able to connect the demand on a particular shift to that same shift week after week and so be able to see these patterns was very difficult at first – especially when they had last happened to work a particular shift weeks ago.
The perception in that hospital was, once again, that demand was highly variable and unpredictable. It is often the same perception in manufacturing companies. Yet, analysis of green item demand – at a percentage level – usually shows demand fluctuates far less than people think. So having a relatively small buffer tank will absorb the demand variability and the fixed repetitive cycle can remain fixed!
Having fixed cycles with buffer limits, compared to batch logic with target inventory levels and re-order points, needs very different ways of working. How one manages, and what tools can help, will be addressed in the next article in this series.
THE AUTHOR

Read more


OPINION – Look at today's disruptive companies and you'll see how all of them have understood that real innovation calls for close proximity to the customer, rather than for stubbornly taking cover in the comfort of the upstream.

FEATURE – The author explores the relationship between kanban and improvement and discusses how using it can impact our lean transformation.

BUILDING BRIDGES – Struggling to scale a new product past its MVP phase, Theodo tried a number of things before realizing that the only way to retain quality and speed is kaizen.

BOOK EXCERPT – These are the opening paragraphs of Chapter 1 of the new Lean Global Network book about applying Lean Thinking in a resort hotel.